But in any case, let's skim over all of that and move onward.
When I saw this post from @MrOrr_Geek earlier this year in February, I immediately gravitated toward it. I engaged Jon immediately after I saw that, as well as also mentioning this video that related to Lego and equality (which he didn't credit me! *shakes fist at Jon*). I then used it a week or so later in my own classroom. Below is a description of how I unpacked it. You will noticed that my approach is actually quite different than how he approached it. Afterall, there are many ways to cook with such a great ingredient right? And what's good about a lesson if it isn't mine - something I paint with my own colours? If you haven't checked out his post yet, it's a good one!
This post will mainly be about describing a series of lesson that related to the Lego activity. The example I'm drawing from is from last year (that's how behind I am with my writing). I had been wanting to reflect on a few things like spiraling, social justice, and attitude toward "fads" or "trends" in education, but I think I'll put all of those on the back burner for now, and just start with unpacking what I did.
I will describe a period of about 9 days that related to this activity. I've actually never written a post quite like this before - where it is more of an overview of the whole thing. The intention is to set up a broad overview so that I could later talk about the details. Over the course of these 9 days, we unpacked 6 out of the 11 expectation, while connecting to 2 more within the course (so that's 8 out of 11 if it even matters. Personally I believe it's more important to build on knowledge naturally rather than forcing it, but I think I will talk about that in a different post where I reflect on spiraling). You may have heard about spiralling from Alex or alternatively read some of my thoughts about it back in 2012 here or here.
Note that I also recently lost most of my pictures... so I don't have lots of beautiful class work to share... :(
Day 1
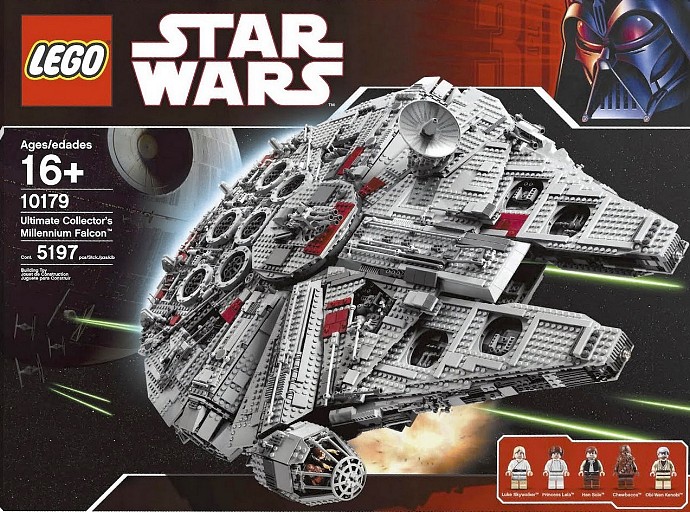
The students come into class and picks up a card similar to the ones described here. There were a few changes to the ones in the link, but basically: I greet the students at the door and pass them a card, they then work together to talk about where they should sit, and then settle in their seats.After they settled in their seats, I showed them an image of the Lego Star Wars and an image of the Lego Friends on the board using the files that Jon shared, except I cut out the words he had at the top.


I asked them to think about what they noticed and what they wonder, and write them down to help them remember. I then sent them to their vertical whiteboards to continue their conversations. I asked them to share their questions with their group members and to write their questions down on part of their board. A lot of good conversations about their questions ensued. They cared about the topic. They were interested to say more. This was an important step to let the questions brew and the tensions mount. I walked around and asked them about their question. I asked them what kind of information might they need in order to answer their questions - whether it would be quantitative or qualitative data. For some groups, I heard some great conversations about gender expectations and social justice. For others, they began to look at price and number of pieces and started to talk about that.
I then gave each group a package of images. Yup you guessed it, I gave each group a few images of Lego Star wars and a few images of Lego Friends. Some were images that Jon had in his post, others were simply farmed and printed from the Legos website here.
I said nothing.
I didn't need to say anything, they were already engaged in conversations, and these images only prompted them to have even more conversations. More than this, most of them have now converged to a type of comparison required more quantitative data. Nice and handy to have more data, then. I encouraged those that continued to chat about social issues. These issues are important to me, and they know that these are important to me. Not to say that they were only talking about these issues because they knew that I was interested in them - but more that they were comfortable in exploring and discussing those ideas further. Eventually though, all the groups moved into talking about questions that are quite similar to: "Which theme's the better deal?"
This movement toward the topic wasn't explicitly forced, although I can imagine that it was created somewhat naturally through the questions and actions spread from one group to another while they were working on their vertical boards. For example, when one group started to make a table to organize their ideas, another group would see that and shift their conversation a bit.
I took an opportunity to listen to the students and to draw out their thinking on several related aspects of the curriculum that had to do with thinking about data, posing problems, reasoning, problem solving, reflecting... so on and so forth.
At this point it was nearing the end of the class and so I asked them to take pictures of what they've worked on so far, and then I debriefed what we all worked on. I drew attention to some of the questions they came up with, as well as shared a few of their thoughts and ideas about the questions. This then led to a discussion about seeking to set up ways of answering their questions, which became an opportunity to talk about quantitative and qualitative data. Throughout this time, I invited several students to share their ideas and thoughts.
I then left them with homework which had to do with 1) continue to practice algebra skills that related to the cards in the beginning, 2) think about questions posed by everyone in the room and 2) create a sketchnote that defined and described various aspects of data.
Day 2 - 4
Students are broken up into a new group, and were asked to share their sketchnotes with each other. At this time I floated around helping students with any issues surrounding the algebraic work. I then briefly talked about quantitative and qualitative research approaches, and then sent them to their whiteboards again.The bulk of day 2 was fairly straight forward. Students worked on their questions - which at this point, all groups decided to work on a question related to "which theme is the better deal" as mentioned before. Throughout this time, I encouraged various groups to use multiple representations, as well as tease out the concept of slope/rate of change a bit for some groups. At the end of the class I also showed the part 1 video that I shared with Jon (mentioned earlier) from Feminist Frequency. At this time I also shared some of my thoughts on the matter, while drawing in some of the points that students pointed out the day before. Students were told that they'd share their work with others, and that they would be given a chart paper the next day to make a "good version" of their work.
Day 3 was fairly straight forward as well. Students continued to work at coming up with a thorough representation of their answers. I basically floated around and cause problems. Through the process of listening to students and prompting them to refine their representations, we tackled lots of ideas within the class: concept of slope and rate of change, scatter plots and lines of best fit, intersection of lines, algebraic equations for predictions... and so on.
Toward the end of this class, I drew their attention to the groups that had established a few different representations of rates of change, and had them make some notes about those. I asked the groups to share why they thought it was useful to have these representations of rate of change and how it helped them tackle the question.
Day 4 was more of the same where I worked with different groups on making sense out of various aspects of what they were doing. This was also the day that I provided them with chart paper for them to share their work with others.
Day 5
Each group of students were then jigsawed into a larger group that had a member from each of the groups that had a chart paper made. Students were asked to note down some general look-fors for every group they came across. This was simply a sheet with plenty of space, and these two questions:1)What did this group work on that was similar to yours and how did they tackle it?
2)What might you add to your own work now that you've seen this group's work?
The focus was on active listening and reflection. They were also encouraged to ask questions.
At the end of the sharing, each group was asked to return to their whiteboards. They were now asked to summarize the mathematical concepts that related to providing an answer for the problem they tackled. This then was done as a whole class discussion where we created a more refined list of what the concepts were. More specifically, we tied them to the expectations of the course indicated by the curriculum document, which I had been sharing and unpacking with the kids since the beginning of the course.
Day 6 - 7
Students came in and were randomly sorted with cards once again.They then see these

And then also this


We go through the standard (Well, I guess not necessarily standard), what question do you have, what do you notice/wonder...etc.
Students then worked on using the models they've built before. Note that this was a new group that they were put in, so they each had a slightly different model. Their first task was to come up with a model that they were all happy with. The focus here was to focus on the reasoning and justifications using their existing models while accounting for errors.
The next day they continued working and we debriefed their strategies and different representations. And then I gave them images of patterns:


*These are images from the amazing site Visual Patterns set up by the wonderful Fawn Nguyen. And these submissions were from @nik_d_maths.
A side note, looking back I probably would have brought the actual legos for the students to use if I had them... but this time they actually just used cube-a-links. With an incoming baby, I imagine I will be collecting legos in the future and so would be able to bring them to class!
The students worked on looking for a big step number (like step 100).
After getting this through multiple representations, though, I asked them about accuracy and confidence for their answer here versus the two examples before of the Taj Mahal and Millenium Falcon. We teased out why they thought they were more accurate with these patterns, and talked about the differences between the data represented here. For some groups, I just focused on the aspects related to their representations and understanding.
Day 8 - 9
Students are randomly sorted again
Students were shown this brief video that I made
We go through a similar process for estimation, commitment, and suggestion of questions.
Students were then given a bunch of linking cubes as I asked them how many they can put together in 5 minutes. They pursued different strategies as I went around and get a better idea about their thinking. *again, note that in the future I would hope to use Legos instead*
The day after the students had an opportunity to finish up the work from the day before. I then asked them how long they thought it would take in order to build the Millenium Falcon? I asked them what models they might consider and how they would put it together, as well as how confident they thought they would be about those times. I showed them the beginning of this video:
And had them come up with their estimations based on their models. I pressed them to consider as many factors as they can - and be as realistic and logical about their estimations. Do we consider breaks in between? Would it take the same amount of time in the beginning versus the end? What about the sizes of the pieces, does that matter? In conversations with the students I also asked them why the guy decided to built components at a time instead of just putting it all together and so on.
Then we watch the end of the video toward the end of the class after we discussed their strategies.
And that was the end of the 9 days.
Throughout the process the students had multiple chances to hit various aspects of the course that we wanted to look at. There were opportunities for them to explore concepts such as rates of change - but the beauty is I didn't hammer those ideas over any individuals' heads if they had a hard time understanding the ideas initially. I pushed them to push themselves as much as I could, and then I looked for other opportunities to bring them up on the following day.
So as you can kind of see, I went a different route than Jon did. His lesson was great and I am certainly a fan of it. But I would never cook it the same way he did.
After all, we aren't the same person!
I am a firm believer that there are many many excellent ideas out there. The most important thing is not about finding the best activities - it's about making them my own. Making them ones that would work for my classroom.
I hope to dig into that thought a bit more in the future, but for now I'll leave it here :)
Very creative and inspiring thanks !
ReplyDelete